This guide describes the steps needed to troubleshoot issues you may encounter when accessing data via xfODBC. For information on troubleshooting issues with system catalog creation, see Troubleshooting system catalog generation.
This topic includes the following sections:
- Flowchart for data access issues
- Step 1: Gather full information on the setup
- Step 2: Get a complete picture of the problem and validate the setup
- Step 3: Research the issue, get the SQL statement
- Step 4: Run ODBC Test
- Step 5: Use logging and reproduce in a test environment if necessary
- Step Ω: Contacting Synergy/DE Developer Support
- Notes on connection problems
- Notes on data access issues
- Notes on performance issues and unexpected results
- Using ODBC Test
Flowchart for data access issues
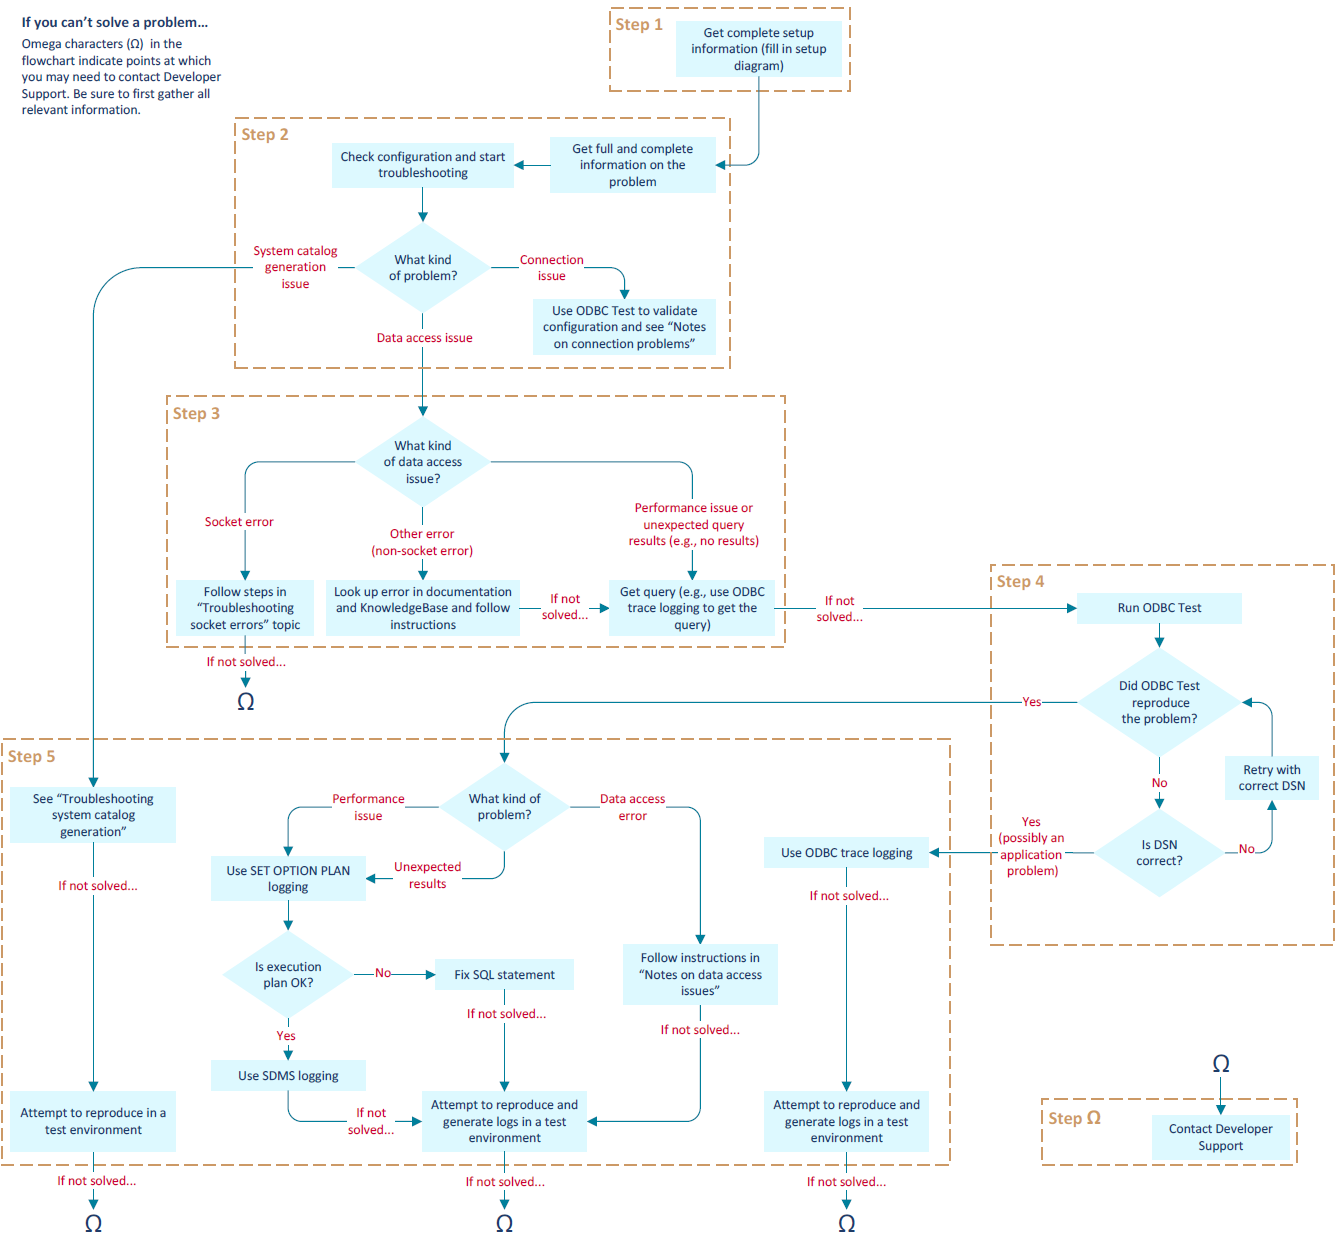
The flowchart below illustrates the general flow of troubleshooting steps for xfODBC data access issues. The sections that follow provide details on these steps.
You won’t necessarily go through all these steps for every data issue with xfODBC. And as the omega characters (Ω) in the flowchart indicate, there may be situations where you’ll need to contact Synergy/DE Developer Support.
|
|
Step 1: Gather full information on the setup
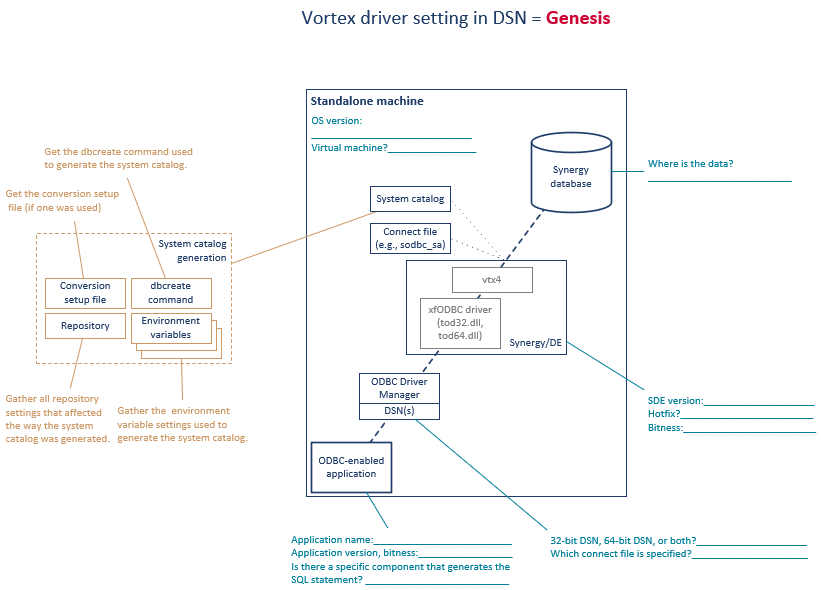
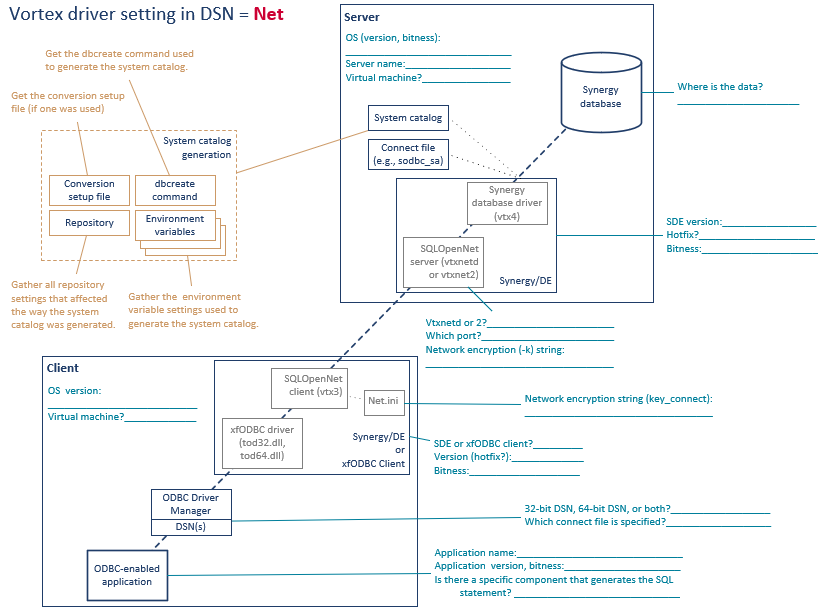
Whenever you encounter an xfODBC issue, you’ll need to start by making sure you have a complete picture of your xfODBC configuration. Gather all the information mentioned in the applicable setup diagram below (stand-alone or client/server), and note any other configuration details that could be relevant.
|
|
|
|
Step 2: Get a complete picture of the problem and validate the setup
In addition to understanding the setup, you’ll need to bear in mind all details pertaining to the problem, and you’ll need to validate the setup.
| 1. | Make sure you can answer the following questions, and gather any other information that could be relevant: |
- What is the problem? Be sure to consider all the symptoms.
- Is there an error? If so, note the error mnemonic and text.
- What are the exact steps that led to the problem?
- What SQL statement was used?
- What changed (for example, code, data, or hardware) before the problem occurred?
- Can you consistently reproduce the problem?
| 2. | Follow instructions in Validating your xfODBC setup for data access to validate your xfODBC configuration and start the troubleshooting process. Also see Notes on connection problems (below), and note that you can use ODBC Test to validate your xfODBC configuration (see Step 4: Run ODBC Test below). |
Step 3: Research the issue, get the SQL statement
Once you have all the pertinent details about your xfODBC configuration and have validated it, find all published information related to the issue:
- If there’s an error, look it up in the xfODBC error documentation (Data Access Errors and Error Logging) and in the Synergex KnowledgeBase. If the documentation or a KnowledgeBase article has troubleshooting information, use that to troubleshoot the problem.
- If the problem appeared after upgrading Synergy/DE, check release note entries for the current version for changes that might have caused the problem.
- For 10054/10061 errors and errors that contain “Connect:errno:error” or ”Recv:errno:error”, see Troubleshooting socket errors.
Then, unless the problem is a socket error or a connection problem, make sure the SQL statement (which you examined in the previous step) is correct. If you’re not sure of the exact query (e.g., a query generated by MS Query), or if you have doubts about the query, run ODBC trace logging, which will show the exact query used by the application. See the notes on logging in Step 5: Use logging and reproduce in a test environment if necessary (below).
Step 4: Run ODBC Test
If in the last step you weren’t able to solve the issue, the next step is to download and run ODBC Test in a stand-alone configuration or on a client in a client/server configuration. (ODBC Test must run on the machine with the DSN used to access the database.)
Make sure ODBC Test can access the database, and then test the query. (If ODBC Test cannot access the database, there is a problem with the configuration. Go back to Step 2: Get a complete picture of the problem and validate the setup.) Make sure you are using the following:
- The correct version of ODBC Test: either 64-bit for a 64-bit application, or 32-bit for a 32-bit application (even if the application is on a 64-bit system). For a Unicode application, use the applicable Unicode version of ODBC Test. (Filenames for Unicode versions end in w—e.g., odbct32w.exe.) For information on how to download, set up, and use ODBC Test, see Using ODBC Test below.
- The correct DSN. The DSN must be the DSN used for the application, and it must have the right bitness (the bitness of the application that generates the SQL statement) and type. For example, if the application uses a user DSN, but you use a file DSN of the same name with ODBC Test, the test will not be valid.
Note: For a 32-bit ODBC-enabled application on a 64-bit system (e.g., a Visual Studio version prior to Visual Studio 2022 on a 64-bit system), there should be two identical DSNs: one 32-bit and one 64-bit (see Adding a user or system DSN).
Using ODBC Test should help you determine whether the SQL statement and setup are correct:
- If ODBC Test does not reproduce the issue (i.e., if the SQL statement works correctly), double-check to make sure the DSN used with ODBC Test is the same as the DSN used by the application. If it is, you may be experiencing an application error, and further logging (described in the next step) will be required to debug the issue. In this case, it may be necessary to attempt to reproduce the error in a test environment.
- If ODBC Test reproduces an issue that causes an error, use the error and the logging recommended in the next step to determine what kind of problem it is, and see Notes on data access issues below for more information.
- If ODBC Test reproduces a performance issue or unexpected query results, use logging as described in the next step and see Notes on performance issues and unexpected results below.
Step 5: Use logging and reproduce in a test environment if necessary
Keep in mind that logging can cause a production environment to slow down, which can be a serious problem. So it is generally best to reproduce the issue in an isolated test environment with a stand-alone configuration and turn on logging in that environment.
The following table lists and briefly describes error logging types commonly used for troubleshooting. For details on the following, for a diagram that shows how the different logging types work with the various xfODBC layers, and for information on logging that’s less commonly used for troubleshooting, see Error logging for xfODBC.
- For data access errors, see Notes on data access issues below and use the following logging: Synergy DBMS logging (on Windows, use SDMS_AUDIT_SRV), Vortex API logging (use VORTEX_API_LOGFILE and VORTEX_API_LOGOPTS=FULL), and ODBC trace logging.
- For performance issues and unexpected query results, the following are generally useful: Vortex API logging, Synergy DBMS logging, and SET OPTION logging. (See Notes on performance issues and unexpected results below.) If system catalog caching is involved, use Synergy driver logging (see Troubleshooting system catalog caching).
|
Logging type |
Purpose |
Notes |
|---|---|---|
|
Logs ODBC API calls passed from the ODBC application to the ODBC Driver Manager |
It is not always possible to use ODBC trace logging for services like SQL Server linked queries. (The trace logging would have to be set, then the system rebooted.) Some additional notes and tips:
|
|
|
Vortex API logging (Windows) and Vortex Host logging |
Record API calls made by the xfODBC driver. |
These are for local connections only (i.e., where the Vortex driver setting in the DSN is set to Genesis). These logs can be difficult to interpret, but they do make it possible to see the exact SQL statement issued to the database, debug SQL statement errors, and verify optimization. There is Vortex host logging for client/server setups (see Vortex host logging), but Vortex API logging is recommended. |
|
Synergy DBMS logging (aka SDMS logging) |
Records ISAM calls made from the Synergy database driver to your Synergy database. |
This is server-side logging. It enables you to debug open file errors, licensing errors, and connection failures. |
|
vtxnetd/vtxnet2 logging (or TCM logging) |
Records connection requests. |
If the program can’t start a worker thread or process, this logging records the reason for the failure. You may be able to use this to determine why a connection is failing in a client/server configuration (e.g., encryption issues) and to find out which OpenSSL version is installed. See also Using data packet encryption for SQL OpenNet. |
|
Records information about indexes used to optimize a query. |
This logging shows you which indexes are being used and whether a statement is optimized. (It is not for error conditions.) See also Creating a file for query processing options. |
|
|
Enables you to determine if a system catalog is cached. |
|
Step Ω: Contacting Synergy/DE Developer Support
By the time you have arrived at this step, you’ve gathered all the relevant information, created a complete picture of the configuration, fully understood the problem, looked up error information, used ODBC Test to validate the configuration and the SQL statement, and generated any logs that could shed light on the issue. If you are still unable to solve the problem, it’s time to contact Synergy/DE Developer Support. See Contacting Synergy/DE Developer Support for more information.
Notes on connection problems
As always, start by gathering all relevant information, looking up the error in documentation and KB, and confirming that everything is set up correctly. It may be necessary to involve your network engineers or IT. Some questions to consider:
- Is the server running? You can use vtxping or synxfpng to test this, as well as vtxnetd/vtxnet2 logging. See Utilities and features for troubleshooting xfODBC for details.
- What is the port/server name or IP address?
- How is the SQL OpenNet server started?
- The same network connection key should be used on both server and clients. Is it? (See vtxnetd and vtxnet2 programs and Setting SQL OpenNet client options in net.ini.)
- Is a firewall enabled?
If you can connect with ODBC Test, but not with your ODBC-enabled application, check the DSN(s).
Notes on data access issues
As always, start by gathering all relevant information, looking up the error in documentation and KB, and confirming that everything is set up correctly. Additionally, note the following:
- Examine the SQL statement to determine which conditions cause the issue. Does it reproduce with specific tables or columns? Does it reproduce with specific data?
- Use Synergy DBMS logging, Vortex API logging, and ODBC trace logging as described in Step 5: Use logging and reproduce in a test environment if necessary above.
For information on errors, see Data access errors.
Notes on performance issues and unexpected results
The following is the basic procedure for performance issues and unexpected results:
- In Step 3: Research the issue, get the SQL statement, run ODBC trace logging to get the query used by the ODBC-enbled application.
Note: It is always best to reproduce performance issues in a stand-alone configuration.
- If you were able to reproduce the performance issue with ODBC Test, turn on SET OPTION logging in Step 5: Use logging and reproduce in a test environment if necessary and examine the execution plan. See Notes on PLAN for information, and keep in mind that all joins should use a key, and every field in a WHERE clause should use a key if one is available.
- If you see no issue with the execution plan, use SDMS logging.
For more information on performance issues, see Optimizing Data Access.
Using ODBC Test
When using ODBC Test to test a configuration or query, it must reside and run on the machine that has the DSN used to access the database, and it must have the same bitness as the ODBC-enabled application that accesses the database. For example, if you want to test a 32-bit application’s access to Synergy data on a 32-bit machine, use a 32-bit version of ODBC Test. For further guidelines, see Step 4: Run ODBC Test above.
To set up and run ODBC Test,
| 1. | Download and install the Microsoft Data Access Components (MDAC) SDK. See Microsoft’s information on ODBC Test for more information. |
| 2. | In the Windows Start menu, expand the “Microsoft Data Access SDK” entry, and select the OCDBCTest entry for your setup. For example, for a 32-bit Unicode application, select “ODBCTest (Unicode, x86)”. |
| 3. | If you want more error information than ODBC Test displays by default, select Tools > Options from the ODBC Test menu, and then select “Automatic Error Checking” and click OK. |
| 4. | Click the toolbar button with the handshake icon (third from the left). This opens a list of DSNs that match the bitness of the version of ODBC Test you are running. |
| 5. | Select the DSN you want to use (e.g., double-click it). If any required information (username, password, or connect file) is not in the DSN, you’ll be prompted to enter it in the “xfODBC Info” window. The defaults for user and password (which should be replaced in production environments) are: |
- DBA or DBADMIN as the user ID
- MANAGER as the password
| 6. | If ODBC Test is able to connect (if the message “Successfully connected to DSN ‘<your DSN name>’” is displayed in the lower pane), enter the query you want to test in the upper pane. |
| 7. | To execute the query, click the toolbar button with the red exclamation mark. A message indicating whether the query was successful will be displayed in the lower pane of ODBC Test. For example: |
Return: SQL_SUCCESS=0
| 8. | To get the result set for the query, click the toolbar button with the grid/table icon (to the right of the button with the red exclamation mark). This will cause the result set to be displayed in the bottom pane of ODBC Test. |
| 9. | To disconnect from the database, click the toolbar button with the icon with two separated hands, which is to the right of the handshake button. |
