This topic includes the following sections:
- Using standard traditional Synergy debugger commands
- Breaking and breakpoints
- Traditional Synergy debugging for Unix and OpenVMS
- Remote debugging
- Restarting xfServerPlus with remote debugging
With Synergy DBL Integration for Visual Studio (SDI), you can use Visual Studio to debug traditional Synergy programs. You’ll use Visual Studio commands to start and control debugging (Start Debugging, Step Into, Break All, Attach to Process, Stop Debugging, etc.), and you can use some standard traditional Synergy debugger commands.
You can also remotely debug a Synergy program — i.e., debug a Synergy program on a different machine (Windows, Unix, or OpenVMS) — even if you have no Visual Studio project for that program. See Remote debugging below.
|
|
The latest version of Synergy/DE (with the most recent hotfix that includes debugger fixes) provides the best traditional Synergy debugging experience in Visual Studio, even if you target only older versions of the Synergy runtime. Traditional Synergy debugging in Visual Studio relies on runtime features distributed with Synergy/DE. |
Before debugging, you must build projects in debug mode. (The debugger can step into a routine only if the project is built in debug mode.) Then, while your solution is open in Visual Studio, set the active configuration/platform combination, and select a Visual Studio debugging command, such as Debug > Start Debugging from the Visual Studio menu. See Visual Studio documentation for more information on the Visual Studio debugger, and note the following:
- The active configuration/platform combination determines which build is debugged and which debug settings are used. See Configurations, platforms, and profiles.
- You can invoke the following standard traditional Synergy debugger commands from the Immediate window during a break in execution: DEPOSIT, SET TRAP, SET UNINITIALIZED, SET WATCH, and any SHOW command. See Using standard traditional Synergy debugger commands below.
- Some breakpoint functionality is different for traditional Synergy in Visual Studio. See Breaking and breakpoints below.
- You can use the %SYN_DEBUG routine to programmatically determine if a traditional Synergy program is running in debug and if it was built in debug mode.
- The Edit Value feature for the Visual Studio debugger (which is on the context menu that opens when you right-click a variable in the editor, for example) is not supported for traditional Synergy. To change the value of a variable as you debug, use the !DEPOSIT command in the Immediate window:
!DEPOSIT var_name=value
See Using standard traditional Synergy debugger commands below.
Using standard traditional Synergy debugger commands
You can use one of the following standard traditional Synergy debugger commands by entering it in the Immediate window when the debugger has paused for a breakpoint: DEPOSIT, SET TRAP, SET UNINITIALIZED, SET WATCH, or a SHOW command.
| 1. | Set at least one Visual Studio debugger breakpoint at a location in code that’s executed before you want the standard traditional Synergy debugger command to take effect. |
| 2. | Start a debugging session for your traditional Synergy program. |
| 3. | When the debugger breaks on a Visual Studio breakpoint, open the Immediate window and type an exclamation point (!) followed by the command. Then press Enter. For example: |
|
|
Be sure to use the exclamation point. If you enter one of these commands without the exclamation point, the debugger will interpret it as a variable, which will cause errors.
| 4. | Continue with the debugging session (e.g., press F5 or select Debug > Continue). |
If you enter a standard traditional Synergy command in this window before starting a debugging session, the traditional Synergy debugger will start in an unusable state.
Breaking and breakpoints
The debugger automatically breaks if it encounters an uncaught error or an unhandled exception (postmortem debugging), allowing the program to display the error message in a pop-up window. (With remote debugging, the debugger also breaks on all caught errors and exceptions, unless you set a command in the Immediate window. See Breaking on handled errors when using remote debugging below.)
- You can set an option that causes the debugger to break on specified caught errors and exceptions. See Debug page of Visual Studio project properties for more information.
- Breakpoints cannot be set in data divisions.
- Standard Visual Studio conditional breakpoints are not supported for traditional Synergy. To set a conditional breakpoint for traditional Synergy, enter the following command in the Immediate window:
!SET WATCH var_name
See Using standard traditional Synergy debugger commands above for more information.
Breaking on handled errors when using remote debugging
When using Visual Studio remote debugging with a traditional Synergy program, the debugger breaks at every exception and error, caught or uncaught. To prevent the debugger from breaking on one or more caught exceptions or errors, use following command in Visual Studio’s Immediate window:
!set trap ignore error_number[, …]
For example, to prevent the debugger from breaking on a “Duplicate key specified” error (error 54), enter the following in the Immediate window:
!set trap ignore 54
For more information on using the Immediate window, see Using standard traditional Synergy debugger commands above.
Note the following:
- The “Break on all caught exceptions and errors except…” and “Error list” fields on the Debug page of project properties do not apply when using remote debugging because no project is associated with the program.
- The “Break when this exception type is thrown” option on the Exception Thrown window (which opens when the debugger encounters an exception) does not apply for traditional Synergy. Selecting it will have no effect.
Traditional Synergy debugging for Unix and OpenVMS
For Unix and OpenVMS, you may be able to run on Windows (see Developing a traditional Synergy application in Visual Studio), which means you may be able to do some debugging on Windows from Visual Studio. For full debugging, run the application on a Unix or OpenVMS machine and then use remote debugging to debug the application from Visual Studio or use standard traditional Synergy debugging on the Unix or OpenVMS machine.
Remote debugging
You can use the Visual Studio Remote Debugger to debug a traditional Synergy program running on Windows, Unix, or OpenVMS. (This includes xfServerPlus server code when xfServerPlus is on a Windows, Unix, or OpenVMS machine.) You don’t need to have a Visual Studio project for the program, but the program must be built in debug mode, SDI must be installed, you’ll need the source file (.dbl) with the code you want to step through, and an open port must be available for Telnet access. The following is a summary of the process; see Remotely debugging a traditional Synergy program below for more detailed steps, and see Breaking on handled errors when using remote debugging above for information on breakpoint behavior.
| 1. | Open the source file in Visual Studio on the development machine and set breakpoints. |
| 2. | Start the program on the remote machine. Use the -dv and -rd options. For example: |
dbr -dv -rd 1965 my_program
| 3. | In Visual Studio on the development machine, select Debug > Attach to Process. |
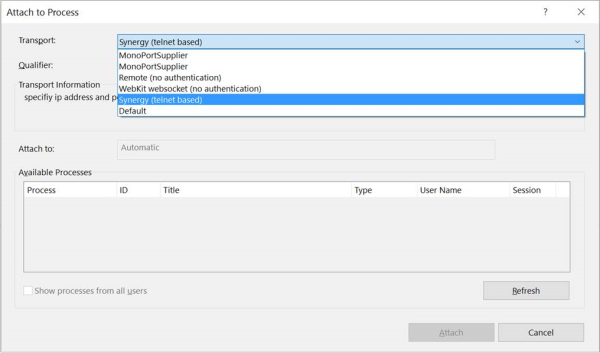
| 4. | In the Attach to Process dialog, set the Transport option to “Synergy (telnet based)”, enter the IP address or machine name in the “Specify IP address and port” field, and press Enter. |
| 5. | In the Available Processes area of the dialog, select “dbr base”. Then click the Attach button. |
Note the following:
- For OpenVMS, you must define the DBG_RMT logical (e.g., $ DEFINE DBG_RMT “-rd 1024:80”). Note that paths are ignored when debugging on OpenVMS.
- For xfServerPlus debugging, the machine running the Visual Studio remote debugging session may be the xfServerPlus machine, the xfNetLink client machine, or a separate machine.
Remotely debugging a traditional Synergy program
| 1. | In Visual Studio, open the .dbl file(s) that you want to step through, and set breakpoints. |
For OpenVMS, the remote debugger ignores paths. The file you open in Visual Studio determines which program on the OpenVMS machine will be debugged. This may not work if more than one file has the same name.
For an xfServerPlus program, this will be the .dbl file (or files) with the routines that are accessed via xfServerPlus.
| 2. | On the remote machine, start the traditional Synergy program you want to debug remotely. |
For client or stand-alone programs, use dbr with the -dv and -rd options. (The -dv option enables Visual Studio debugging mode, and the -rd option specifies the remote debugging port.) For example:
dbr -dv -rd 1965 my_program
For OpenVMS, use the RUN command. For example:
$ RUN MY_PROGRAM
For xfServerPlus server code, restart the xfServerPlus session with remote debugging enabled (or you can start a completely new session on a different port if desired). Then run the xfNetLink client application so that a connection is made to xfServerPlus and the xfServerPlus code is invoked. See Restarting xfServerPlus with remote debugging below.
|
|
If there is a firewall between xfServerPlus and the Windows machine with Visual Studio (which uses a Telnet client for remote debugging), the firewall must be configured to allow Telnet access on the debug port number. (Most firewalls are configured to prohibit Telnet access.) If you do not have authorization to reconfigure the firewall, you can either run Visual Studio on a machine within the firewall or use another debug method. If the xfNetLink Java or .NET client uses pooling, you should set both the minimum and maximum pool size to 1 before using Visual Studio remote debugging. |
| 3. | Open the Attach to Process dialog in Visual Studio (Debug > Attach to Process). |
| 4. | In the Attach to Process dialog, select “Synergy (telnet based)” from the Transport drop-down list. |
|
|
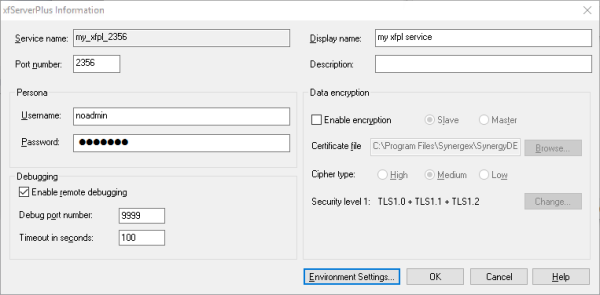
| 5. | In the “Specify IP address and port” field, enter the IP address or machine name and the port number separated by a colon (for example, 172.16.254.1:1965 or localhost:1965) and press Enter. (Do not click the Find button.) For xfServerPlus server code, make sure the port you specify is the debug port number specified for remote debugging in step 2. (For the example illustrated in figure 4 below, the port number would be 9999.) |
| 6. | Make sure the “dbr base” process is selected in the Available Processes section of the dialog, and then click Attach. Note the following for xfServerPlus: |
- If you are prompted for the location of launcher.dbl, click Cancel. Then select the debugger Continue command (Debug > Continue).
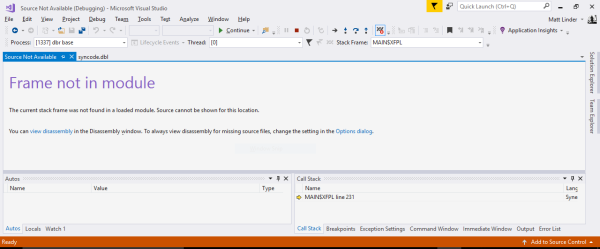
- If the debugger opens at a location with no source (“Frame not in module”), select the Continue command for the debugger (Debug > Continue).
3. If debugger opens with no source, select Continue.

Once connected, the remote debug session works just like any other Visual Studio debug session for traditional Synergy. If you get an error, check the time-out setting and make sure it is long enough for you to complete step 3 through step 6.
If paths on the remote machine don’t match specified paths, Visual Studio dialogs will open as you debug, prompting you for paths.
When you are finished debugging an OpenVMS program, unset the DBG_RMT logical.
When you are through debugging an xfServerPlus program, run the Synergy Configuration Program (or restart rsynd without the -rd option) to turn off remote debugging. If you leave remote debugging enabled, the server will always wait for the specified time-out before continuing with the application. Note the following for xfServerPlus:
- Time-outs or other failures are logged to a file named rd.log, which is created in the DBLDIR directory (or the TEMP directory on Windows) when the first entry in the file is logged. This file contains the process ID of the instance of the runtime that logged entries, the date and time entries were logged, and specific messages. If you are having a problem debugging remotely, check this file first.
- (Windows) If the TEMP logical is not set in the Synrc node in the Windows registry, rsynd will put the log file in a system-defined location, most likely somewhere in the c:\Users path. We recommend that you use the Synergy Configuration Program to explicitly set TEMP in the registry for remote debugging. (Remember that rsynd only reads environment variables set in the registry, not the environment.)
Restarting xfServerPlus with remote debugging
To restart the xfServerPlus session with remote debugging enabled, do one of the following:
On Windows,
| 1. | Run the Synergy Configuration Program. |
| 2. | On the xfServer/xfServerPlus tab, select the desired xfServerPlus service and click the Modify Service button. |
| 3. | Select “Enable remote debugging”, specify a debug port number for the server to listen on for the Telnet client (which is the Visual Studio remote debugger), and indicate a time-out value, if desired. |
The default time-out is 100 seconds. This determines how long the server will wait for a Telnet connection after the xfNetLink-xfServerPlus connection has been established. This time-out should always be less than the connect time-out set on the client (which defaults to 120 seconds), but it needs to be long enough for you to attach to the xfServerPlus process (step 3 through step 6 above) after the client connects to xfServerPlus.
| 4. | OK the modify dialog, and then click the Apply button on the xfServer/xfServerPlus tab to restart xfServerPlus with debug enabled. |
|
|
For details on using the Synergy Configuration Program, refer to the Synergy Configuration Program online help.
|
|
When remotely debugging xfServerPlus server code on Windows, xfpl.dbr uses the regular runtime (dbr) instead of the non-interactive runtime (dbs). This means that your environment may change, because dbr always reads the synergy.ini file, whereas dbs reads it only when SFWINIPATH is set. We recommend that you use SFWINIPATH to point to the location of your synergy.ini file and thereby avoid potential problems. For information on dbs, see Non-interactive runtimes (Windows and Unix). |
On Unix,
| 1. | Stop the current xfServerPlus service, and then restart it with the -rd option: |
rsynd -rd debug_port[:timeout] -w -u xfspAcct
where debug_port is the port number that the xfServerPlus machine should listen on for the Telnet client, and timeout is the number of seconds that the server should wait for a Telnet connection after the xfNetLink-xfServerPlus connection has been made.
The default time-out is 100 seconds. This should always be less than the connect time-out set on the client (which defaults to 120 seconds), but it needs to be long enough for you to attach to the xfServerPlus process (step 3 through step 6 above) after the client connects to xfServerPlus. (For more information about starting xfServerPlus, see Running xfServerPlus on Unix. For complete rsynd syntax, see rsynd program.)


